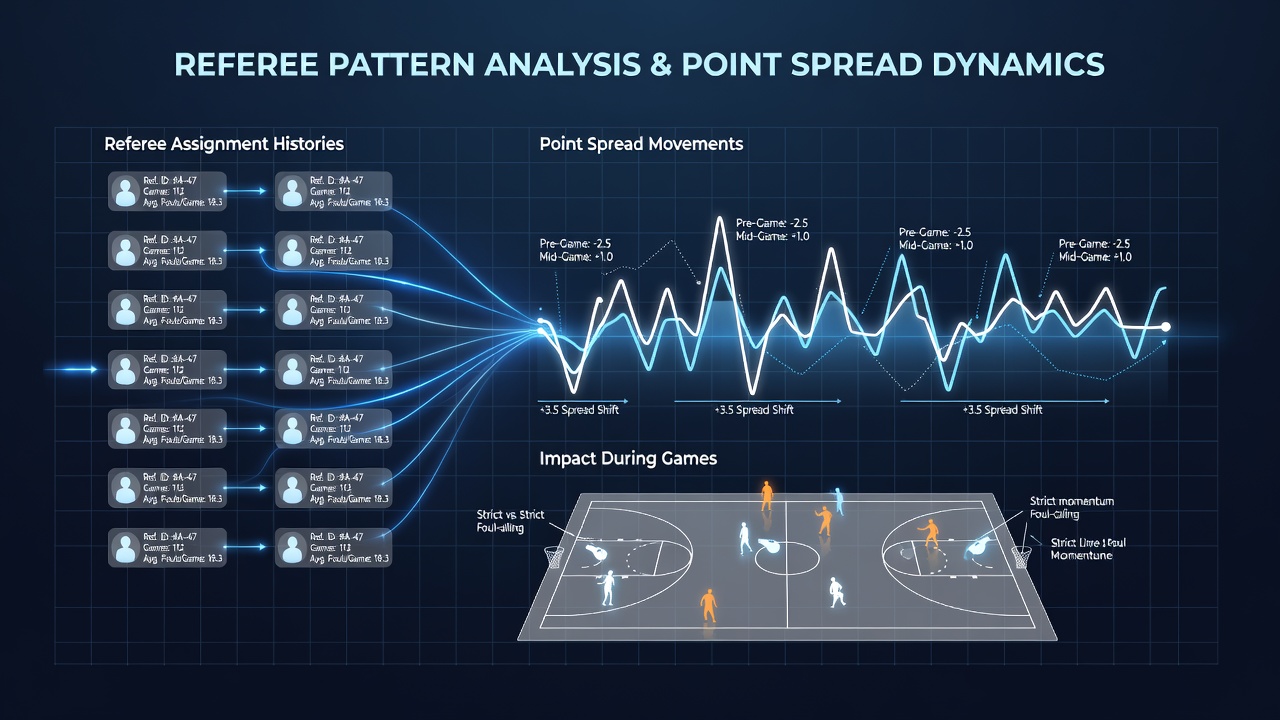
Spotting Patterns in Referee Assignment Histories and Their Impact on Point Spread Movements During Games
Referee assignment histories provide a detailed record of officiating tendencies across multiple seasons and leagues, and these records often align with observable shifts in point spread movements before and during games. Data compiled from professional basketball, football, and hockey schedules shows that certain officials consistently favor specific foul or penalty rates, which bettors and oddsmakers incorporate into line adjustments. In October 2026, tracking systems used by sports analytics firms continue to update these histories in real time, allowing for quicker identification of patterns that influence both pregame spreads and in-game fluctuations.
Collecting and Organizing Referee Data
League offices release referee schedules weeks in advance, and independent researchers aggregate these assignments with historical performance metrics such as fouls per game, technical foul frequency, and overtime involvement. Organizations like the NCAA maintain public officiating databases that list crew assignments alongside season-long statistics, while similar efforts appear in professional leagues through third-party data providers. Analysts cross-reference these figures with team performance records to isolate variables that correlate with spread movements, including home-versus-away crew compositions and travel schedules that affect fatigue levels among officials.
Patterns emerge when the same referee works multiple games involving the same teams within a short window, and statistical models quantify how these repeat assignments alter expected scoring margins. For instance, crews known for stricter enforcement of defensive contact tend to compress spreads in high-scoring matchups, prompting oddsmakers to adjust totals and sides accordingly.
How Assignment Histories Influence Spread Calculations
Bookmakers integrate referee data into proprietary algorithms that recalculate spreads as assignments become public. Historical analysis reveals that games officiated by crews with elevated foul rates produce larger point-spread volatility during the first quarter, because early whistles shift possession counts and scoring pace. Data from multiple seasons indicates that these movements often stabilize once the game reaches halftime, yet initial line shifts can reach several points when the assigned crew deviates from league averages.
Live betting markets react further when in-game statistics confirm or contradict the pregame expectations built from assignment histories. A referee with a documented tendency to call fewer traveling violations may allow extended offensive possessions, leading to incremental spread adjustments as the game clock progresses. Researchers tracking these correlations note that the magnitude of movement depends on the disparity between the official's historical profile and the average performance of the current crew.
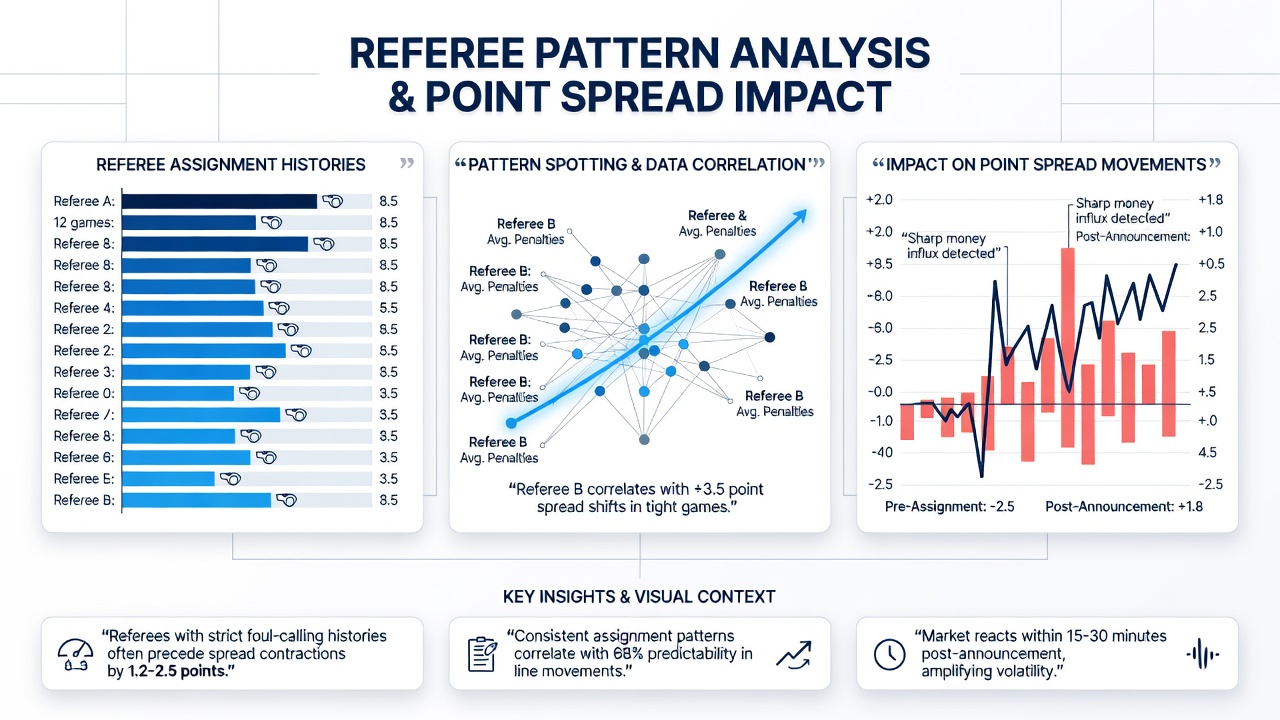
Case Examples from Recent Seasons
One documented instance involved a National Basketball Association crew whose prior assignments showed a 12 percent increase in free-throw attempts for home teams. When that crew received a high-profile matchup in October 2026, opening spreads moved by 1.5 points toward the home side within hours of the announcement, according to market tracking reports. Similar patterns appear in National Football League games where officials with elevated penalty-yardage averages work contests between pass-heavy offenses, resulting in measurable compression of underdog spreads during live trading.
International competitions add another layer, as assignment histories from events governed by FIBA or IIHF demonstrate comparable effects on spreads offered by global operators. Analysts observe that these patterns hold across different regulatory environments, including oversight from bodies such as the Australian Sports Commission, where referee performance data feeds into both competition integrity reviews and secondary market pricing models.
Tools and Methods for Pattern Detection
Software platforms aggregate referee histories into searchable dashboards that flag deviations from seasonal norms, and users apply filters for variables like game location, team style, and time of season. These tools combine assignment data with real-time line feeds, enabling identification of spreads that have not yet incorporated the latest crew information. Academic studies published through university sports analytics programs further refine detection methods by applying regression models that isolate referee effects from other factors such as travel fatigue or coaching changes.
Market participants monitor multiple sources simultaneously, including league press releases and independent statistical repositories, to verify assignment accuracy before spreads fully adjust. When discrepancies arise between published schedules and actual on-court crews, rapid line movements follow as corrected histories enter pricing algorithms.
Conclusion
Referee assignment histories supply measurable inputs that shape point spread movements across professional and collegiate sports. Ongoing data collection through league databases and independent research continues to map these relationships, while live markets in October 2026 reflect the cumulative impact of historical tendencies on both pregame and in-game pricing. Observers tracking these intersections find consistent correlations between officiating profiles and spread volatility, supported by quantitative analysis from multiple regulatory and academic sources.